The Case for Being a UX Unicorn: Learning to Work More Effectively with Web Developers (Book Review)

A review of Bridging UX & Web Development by Jack Moffett. A good base for getting started with learning to code. [Read More]
UX Infographics: 9 to Pin to Your Wall

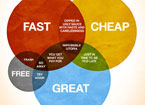
Nine infographics communicating user experience principles with different visual treatments provide an overview of principles of infographic design. [Read More]
Feature Fake: Exploring and Testing Connected Mobile Prototypes

Exploring interactive, mobile products needs realistic interaction. Faking features and connectivity can help make wearables seem real enough to test early concepts. [Read More]
Social Math: Making Complex Data Meaningful

Social math makes statistical data more approachable to the audience by comparing it to familiar data. Guidelines show how to design a social math infographic. [Read More]
Visual Analytics: Uncovering the Why in Your Data

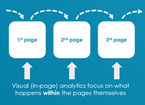
Traditional web analytics can be difficult to translate into decisions. Visualizing analytics data provides insights into users’ behavior and removes opinions from the design process. [Read More]
Dear Diary: Getting the Most from Respondent Journals and Diaries

Diary research is an art and a science that can add depth to your research and meat to your insights, often at minimal extra cost. [Read More]
Visualizing Tax Returns: Showing the Impact in Design

The right information visualizations can help customers confused about their tax refunds and help them make the right decision for their finances. [Read More]
Twinlist: A Multi-Step Interface to Reconcile Medication Lists

Novel spatial layout and multi-step animation help medical staff compare two lists of medications and rapidly select the drugs for a reconciled list, reducing errors. [Read More]
The Impact of Images: Research on Users’ Processing and Perception

Eye tracking study results show that images of people grab the attention of users and have substantial impact on their processing and perceptions of webpages. [Read More]
Designing for Vulnerable Users: Illustrations (May) Help Understand Complex Health Websites

Illustrations have the potential to aid in understanding complex health information, but using images effectively requires testing to tailor them to the needs of a wide variety of users. [Read More]
Rubes Cartoon: Dolphins

Cartoons from the wild and twisted world of Leigh Rubin, syndicated cartoonist. [Read More]


