Articles about 정보 시각화
UX 인포그래픽스: 기억해 둘 9가지 사항
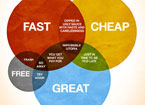
여러 가지 시각적 요소가 곁들여진 인포그래픽스 커뮤니케이션에 대한 사용자 경험 9가지 원칙은 인포그래픽스 디자인 원칙에 대한 개요를 보여줍니다. [자세히 읽기]
사회적 수학: 복잡한 데이터를 의미있게 만들기

사회적 수학은 통계 자료를 보다 친숙한 자료들과 비교함으로써 사람들이 보다 쉽게 접근할 수 있게 합니다. 가이드라인에서 사회적 수학 인포그래픽을 어떻게 디자인할 수 있는지를 보여줍니다. [자세히 읽기]
시각적 분석: 데이터가 만들어진 이유 밝히기
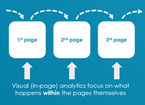
기존의 웹 분석은 디자인적 결정으로 변환하기가 어렵습니다. 분석 데이터를 시각화하게 되면 통찰력을 사용자의 행동에 적용할 수 있고 디자인 절차에서 나오는 의견은 격리할 수 있습니다. [자세히 읽기]
세금 환급의 시각화: 디자인에서의 영향 표시

올바른 정보 시각화는 세금 환급에 대해 혼란해하는 고객들이 재정 관리를 할 때 올바른 결정을 내릴 수 있도록 도와 줍니다. [자세히 읽기]
쌍방형 정보 시각화: 최고의 UX 실행 사례들

해석하기 쉬운 시각적 데이터 묘사 및 그에 따른 쌍방형 경험을 돕기 위한 원칙들과 더불어, 무엇이 효과적인 쌍방형 정보 시각화를 만드는지 실례를 보여줍니다. [자세히 읽기]
지하철 노선도(서평)
Underground Maps Unravelled 와 Vignelli Transit Maps 에관한서평. [자세히 읽기]
도식화하기: 보이지 않는 것을 가시화하는 (서평)
A review of Designing Diagrams: Making Information Accessible through Design by Jan Gauguin.
One recent and five classic books about diagramming, the visual depiction of structures and processes that help us to understand and to interact with complex information. [자세히 읽기]
그래픽 디자인: 두 가지 시각 (서평)

A review of Graphic Design: A New History by Stephen J. Eskilson and Graphic Design Solutions by Robin Landa [자세히 읽기]
(English) Book Review: Do’s and Don’ts of Information Graphics
(English) A review of The Wall Street Guide to Information Graphics: The Do's and Don'ts of Presenting Data, Facts, and Figures by Dona M. Wong. Guide to creating information graphics that are usable, useful, and appealing, especially in the business and advertising world. [자세히 읽기]
(English) Information Graphics: An Eclectic Celebration

(English) Guidebooks on effective visual communication are frequently published for those who have not been exposed to information design and visualization, often obscuring similar publications of decades past. [자세히 읽기]
(English) Book Review: It’s Show Time!

(English) These guidebooks are for those who have not been exposed to the philosophy, principles, and techniques of information design and information visualization. [자세히 읽기]

